Telescope images can tell us a whole lot about celestial objects: where they are located in the sky, how bright they are, how big they are and their shapes, among other attributes. But these pictures are two-dimensional, and astrophysicists need a different tool to measure how far away objects are from Earth in our ever-expanding universe.
That tool is spectroscopy.
“The spectroscopic information adds depth,” says Marcelle Soares-Santos, an assistant professor of physics at the University of Michigan who uses spectroscopy data in her work investigating the expansion of the universe. “It’s one of the key tools we have available to unveil mysteries about the physics of dark energy, dark matter and inflation because it allows us to build a 3D map.”
Spectroscopy relies on the fact that all matter emits light, and different materials emit different arrays of light depending on their composition, temperature and motion.
Unfortunately, this isn’t the dazzling show you might imagine, as much of this light is invisible to the human eye. Light’s full range spans from gamma rays at one end, which are “bluer” and have shorter wavelengths, to radio waves at the other, which are “redder” and have larger wavelengths. Only a small sliver of this range makes up the familiar rainbow of visible light.
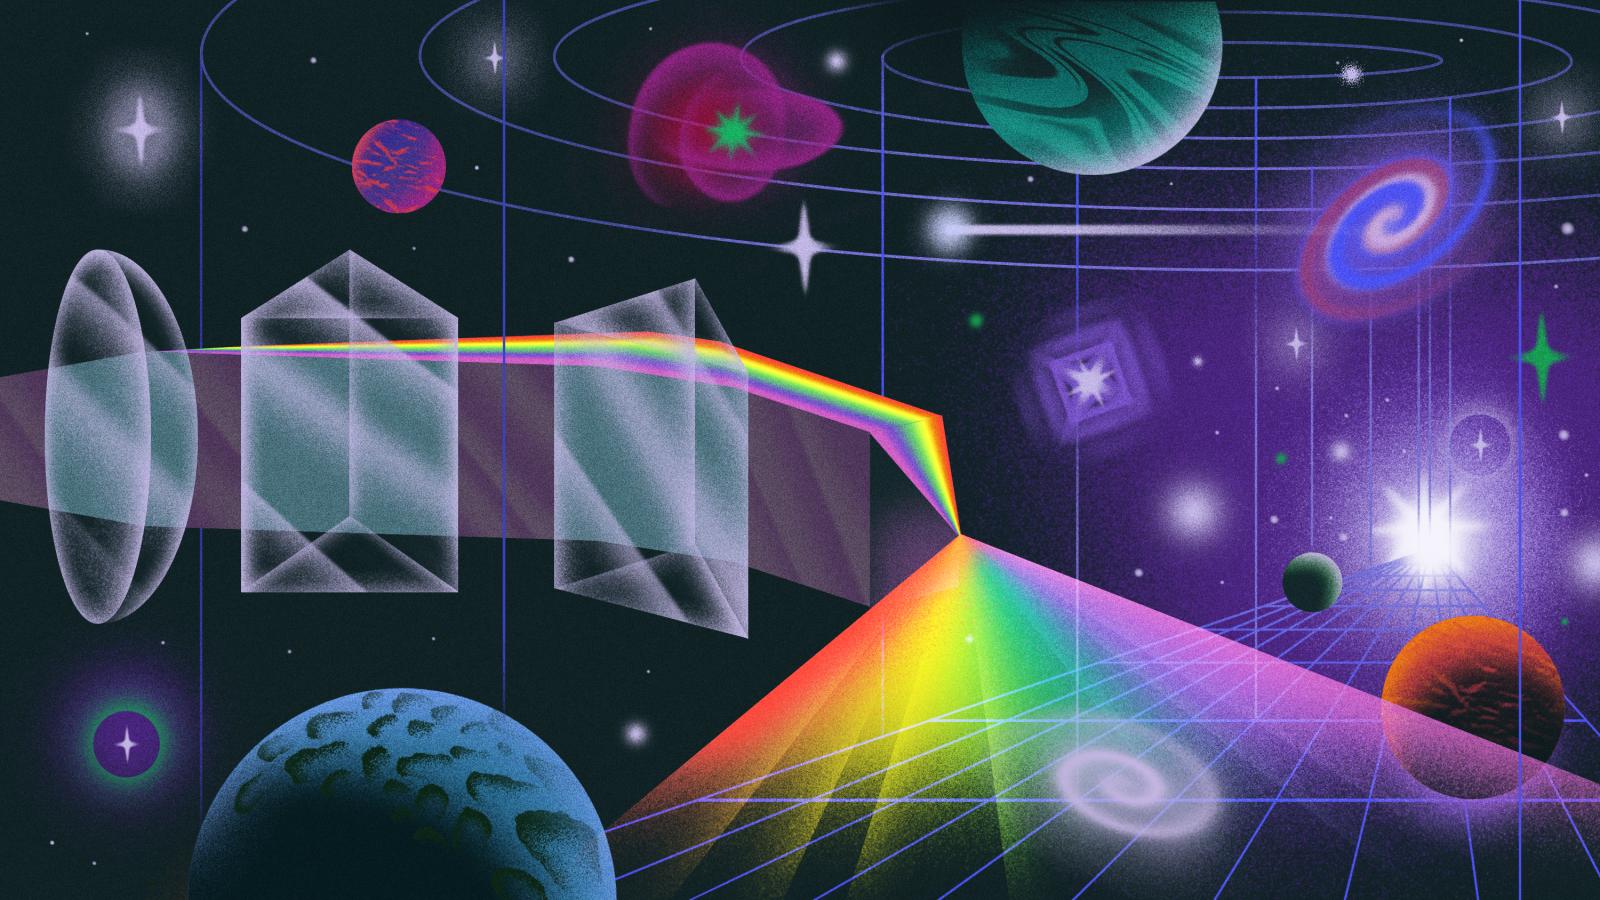
In spectroscopy, an emission spectrum describes what wavelengths, or colors, an object emits. To collect the emission spectrum of an object in space, such as a star or galaxy, astrophysicists hook up a prism-like tool called a diffraction grating to a telescope. Instead of taking normal images, the diffraction grating breaks up the light emitted by the target into its constituent colors.
The obtained spectrum can then be used to figure out the composition and temperature of an object. It’s also crucial for determining the distance of an object from Earth.
For more than two decades, cosmologists have been harnessing spectroscopy to investigate questions related to dark matter and dark energy. During the recent Snowmass high-energy physics community planning process, scientists discussed powerful new spectroscopic instruments that could increase our reach into the stars.
Seeing red
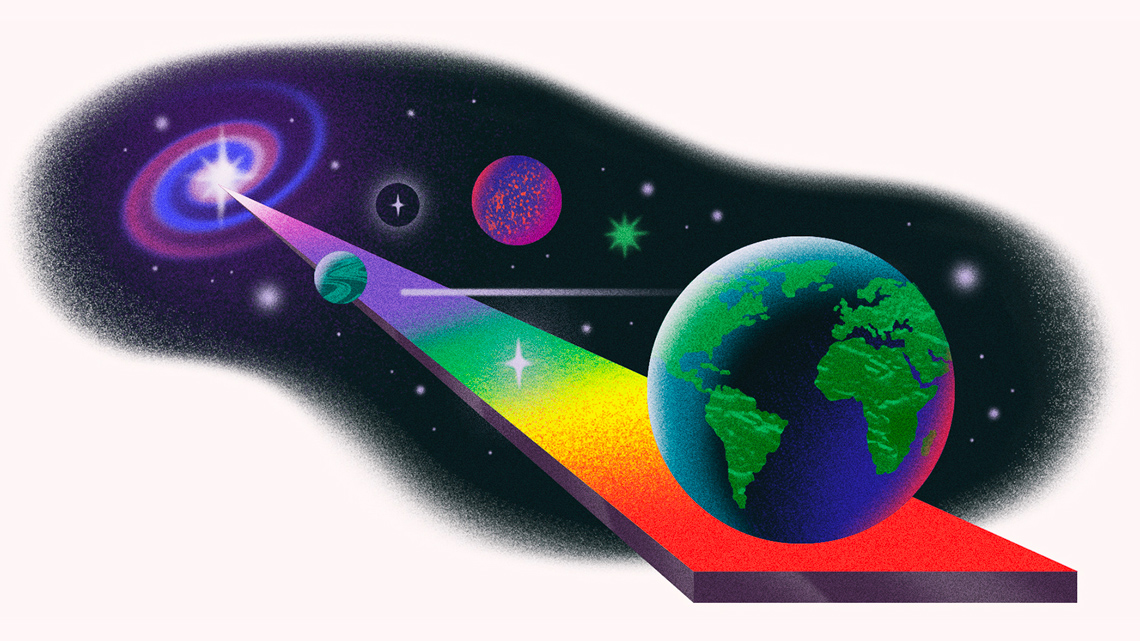
Because the universe is expanding, the wavelengths of light emitted by a star or galaxy get stretched as they travel toward Earth. This shifts an object’s entire emission spectrum toward the “redder” end of light’s range. However, the pattern of the spectrum remains the same compared to similar stars or galaxies closer to Earth.
The amount the spectrum moves is known as its redshift, which acts as a measure of distance from Earth.
“You wouldn’t have any information about the distance without the redshift,” says Dragan Huterer, a professor of physics at the University of Michigan.
The greater the redshift of an object, the further away it is from Earth. The further that light has traveled, the longer ago the light was originally emitted.
“Looking further out, by finding objects at higher and higher redshifts, we're looking further and further back in time,” says Tim Tait, a chancellor's professor of physics and astronomy at the University of California, Irvine. “By measuring spectroscopic information, people are able to make a really accurate timeline for how the universe has been evolving for billions of years.”
Astrophysicists use spectroscopy to check their understanding of dark energy and dark matter.
In 1998 scientists discovered that our universe is expanding at an accelerating rate. They dubbed the phenomenon responsible for this escalating expansion “dark energy,” which is thought to be spread evenly throughout the universe.
Although it has a similar name, dark matter is believed to have the opposite effect. Scientists call “dark matter” the invisible stuff that seems to gather in clumps and exert a gravitational pull on everything around it, collecting matter together instead of pushing it apart.
Based on their understanding of dark matter and dark energy, scientists make predictions about how galaxies should be distributed in the universe. The 3D image that spectroscopy provides allows them to check their predictions against reality.
From 2000 to 2008, the Sloan Digital Sky Survey’s telescope in New Mexico collected redshifts and combined them with images to map the distribution of 930,000 galaxies reaching 8 billion years in the past.
“Sloan transformed the way we see the universe,” Tait says. “We were able to reconstruct the universe and understand things about dark matter and dark energy that we just otherwise would not have been able to learn.”
The galaxies mapped by SDSS matched long-standing predictions of galaxy distribution. By showing the predictions matched reality, SDSS reinforced the cases that both dark matter and dark energy exist.
However, much more spectroscopic information is needed to learn about their detailed physics. And to do that, astrophysicists must use a more sensitive instrument.
In Arizona the Dark Energy Spectroscopic Instrument, or DESI, which began collecting data in 2021, is making 3D maps of the universe pushing further out than SDSS, reaching 11 billion years in the past and mapping 35 million galaxies.
This order of magnitude improvement in spectroscopic capability is achieved through an increase in telescope size and efficiency. Whereas SDSS’s telescope was 2.5 meters across and could look at 640 to 1,000 targets in the sky at one time, DESI’s is 4 meters and can look at 5,000 targets at one time.
Compared to SDSS, DESI’s telescope will be able to study objects further away from Earth as well as collect spectra for galaxies that are closer to each other in the sky.
Different theories of dark matter and dark energy’s physics predict different galaxy distributions, so these more detailed 3D maps of the universe should help refine theories about their properties. “This will now be possible with DESI and future experiments,” Soares-Santos says.
The future will go even further back
There are several similar proposals in the works for spectroscopic instruments that will go beyond DESI’s capabilities. These proposed projects, to construct what are known as “Stage Five” spectroscopic facilities, would produce even more comprehensive 3D maps of the universe than DESI, going back 12 billion years—only a couple billion years after the Big Bang.
“We want to push things as far out as we can,” says Jeffrey Newman, a professor of physics and astronomy at the University of Pittsburgh who helps collect spectroscopic measurements to study how galaxies evolve and how the universe has grown.
In addition to continuing DESI’s work narrowing down our theoretical understanding of dark matter and dark energy’s physical properties, the Stage Five facilities will also unlock insights into physics mere moments after the Big Bang by targeting cosmic inflation.
Inflation is a period a tiny fraction of a second after the Big Bang when the universe’s expansion rate dramatically increased as it grew from smaller than an atom to about the size of a marble. This expansion then slowed before accelerating due to dark energy roughly 7.5 billion years ago. Astrophysicists want to look for inflation’s fingerprints on the universe, but to do so they’ll need even more data than DESI will provide.
“It’s very hard studying what happened a fraction of a second after the Big Bang,” Newman says. “The universe was opaque for its first few hundred thousand years, so we can't see any light from then. Our hope is to look for these fingerprints of inflation by looking at maps of the universe from the Stage Five facilities. In particular, we want to know how the inflation stopped. Did it stop suddenly or gradually?”
Different theories of inflation predict different types of fingerprints, which the Stage Five facilities will be able to measure. Though they will seek the same thing, these proposed projects vary in size, design, location, cost and timescale.
One proposed facility, the Maunakea Spectroscopic Explorer, would replace an existing telescope in Hawaii with a new telescope 11 to 13 meters in diameter. While Maunakea is in the northern hemisphere, two other proposed Stage Five facilities, MegaMapper and the European Southern Observatory SpecTel, would be in the southern hemisphere, in Chile. SpecTel’s telescope is currently projected to be 10 to 12 meters, whereas MegaMapper’s telescope would be the smallest of the three at 6.5 meters in diameter.
“It’s exciting that we have these many different proposals with a similar goal because it means that the community is thinking really hard about all possible ways of doing it,” Soares-Santos says. “In the so-called cosmic frontier, the scientific questions at hand are so big we need to approach them with multiple experiments.”