Yesterday we introduced you to the collision event displays used by Large Hadron Collider physicists, and explained one type of display used by the CMS experiment. Today we’ll delve into the details of this ATLAS experiment event display.
First things first
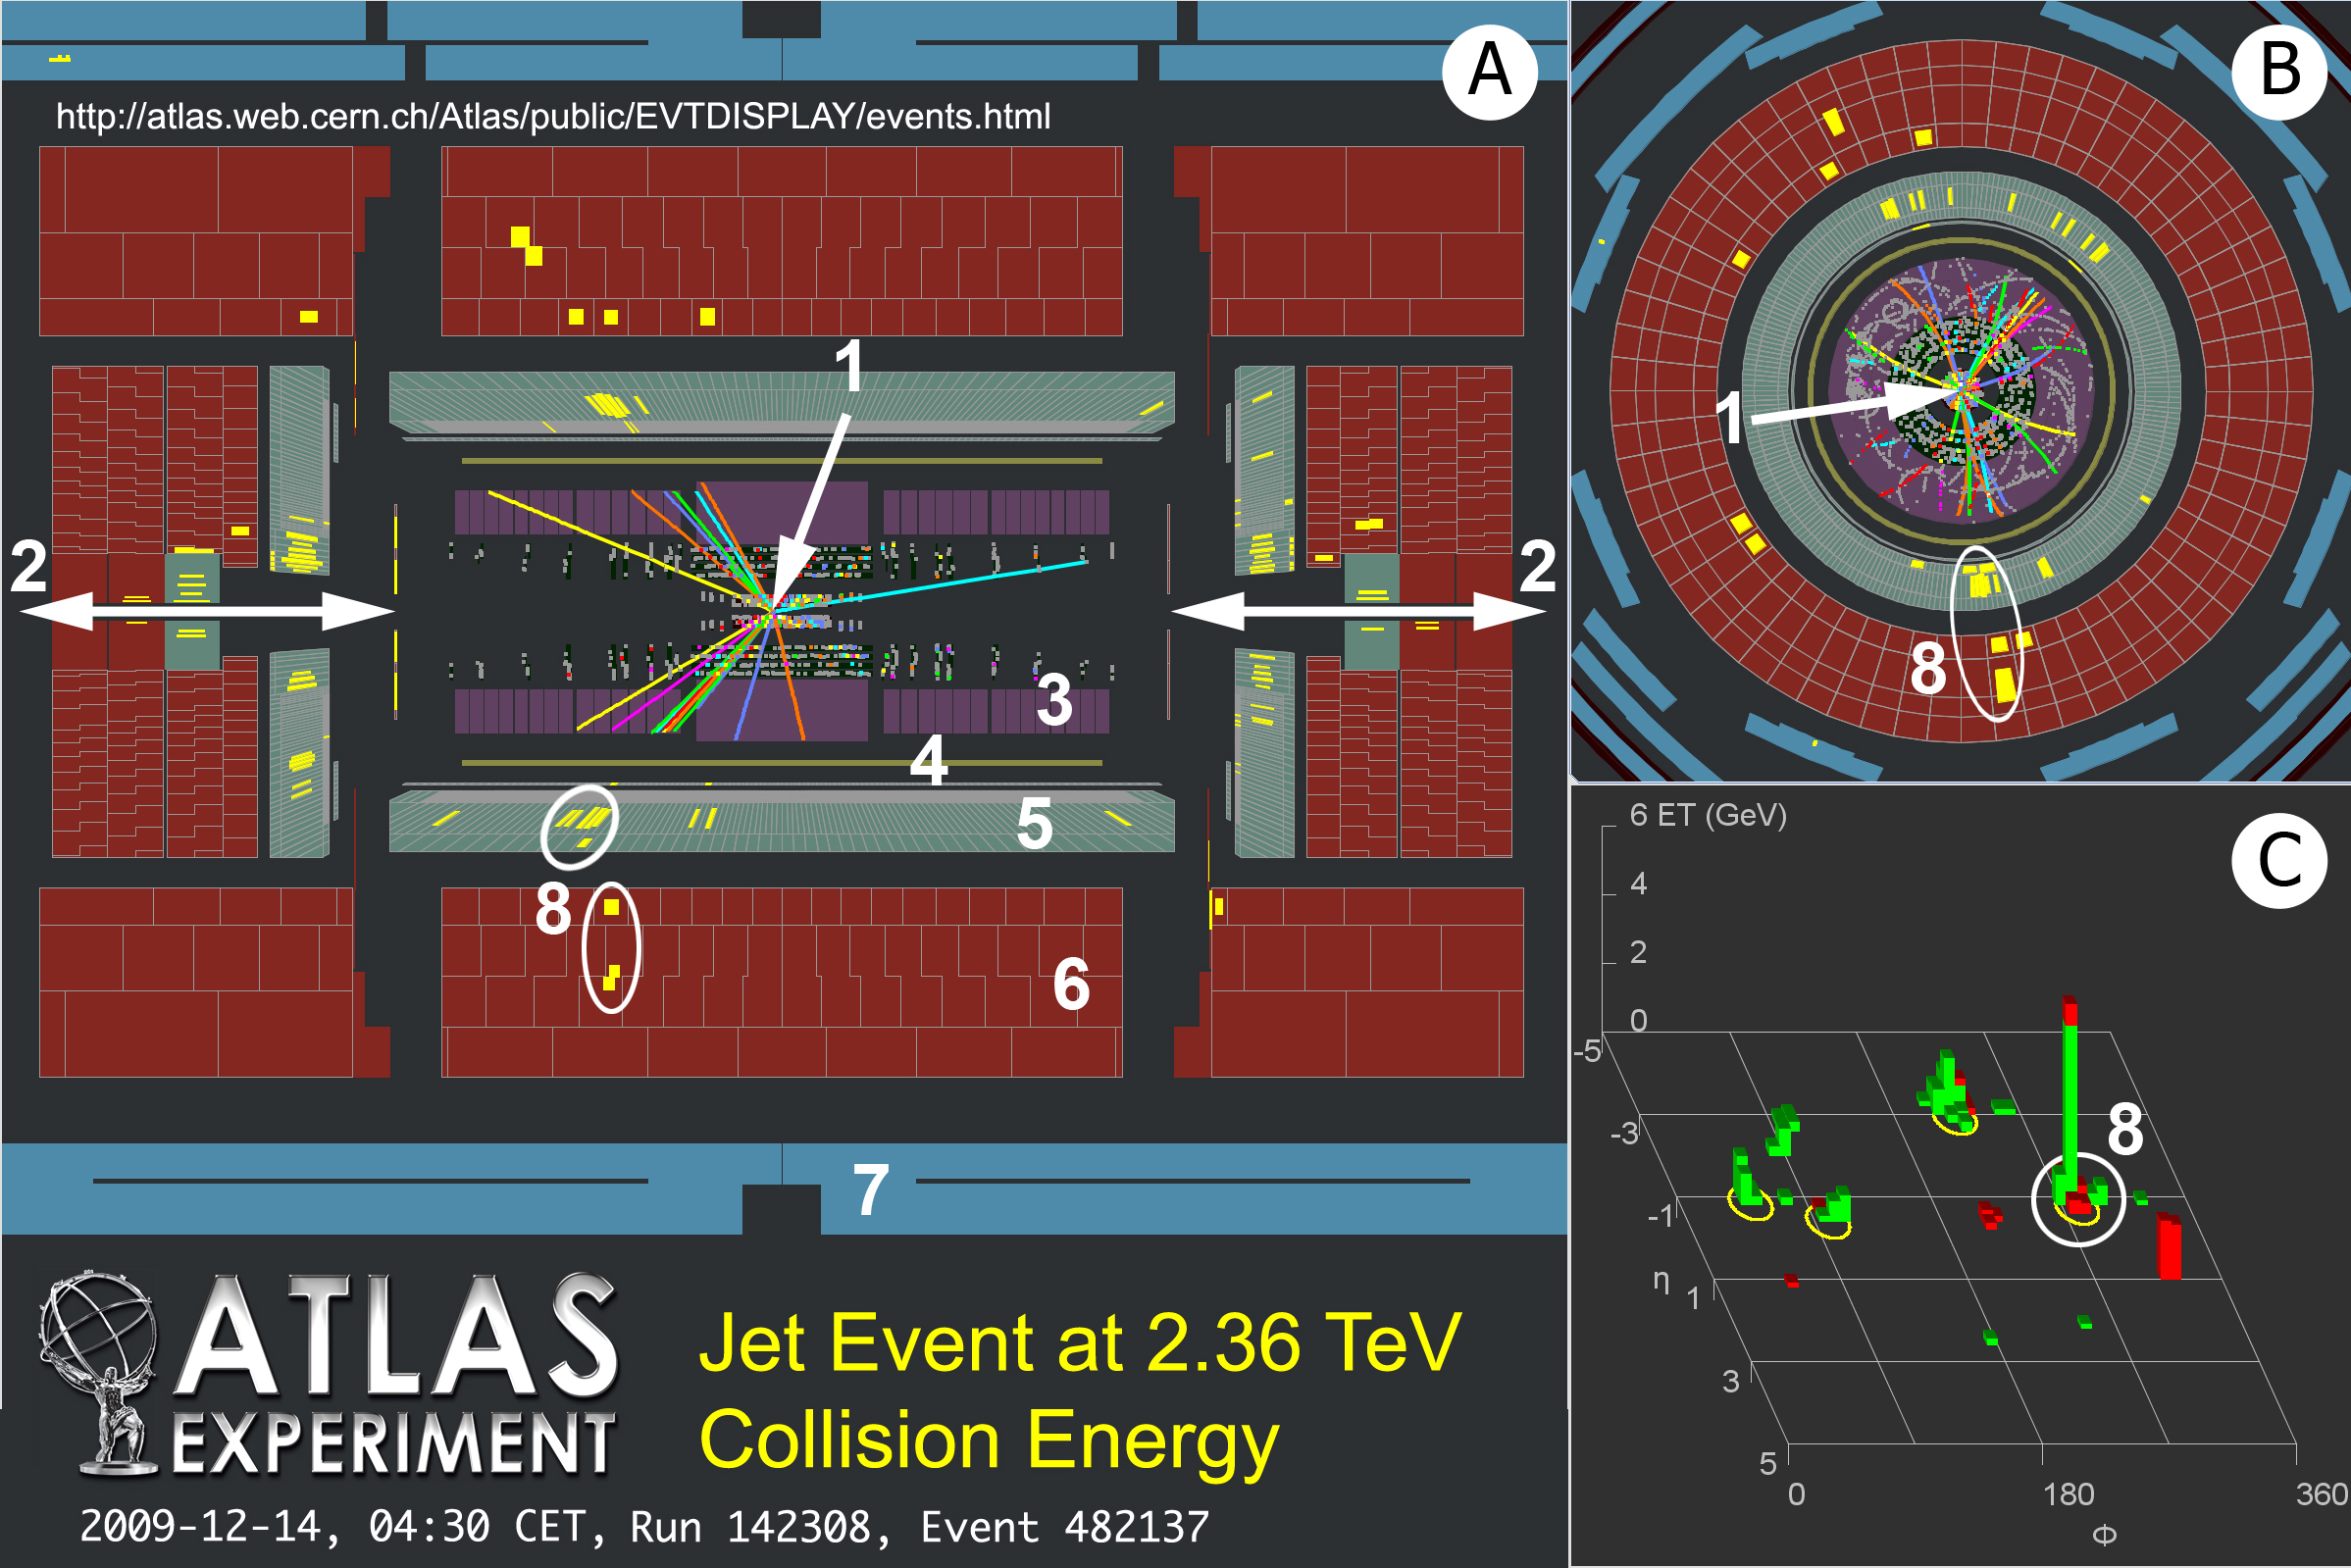
Check out the title and text at the bottom left of the event display. The ATLAS Experiment logo lets you know which particle physics collaboration produced the display – an important distinction when there are four massive experiments recording and analyzing LHC collision data.
Next, the title tells you what type of collision event you’re viewing. This event display shows the production of jets from the collision of two protons, each of which had an energy of 1.18 trillion electron volts (TeV). Jets—sprays of particles that fly out from certain high-energy collisions—indicate that two protons have collided head-on. These violent collisions are the ones that are likely to produce new, heavy particles, and thus physicists expect to see jets in the signatures of almost every interesting LHC collision.
Finally, there is the date, time, run and event numbers. This collision was recorded on December 14, 2009 at 4:30 a.m. Central European Time (the time zone of the CERN laboratory in Geneva, Switzerland). Run and event numbers are used by physicists to catalog their data. Run numbers are unique. The first ATLAS run was recorded years before the LHC circulated its first beam, and run number will increase throughout the decades-long life of ATLAS. The event number resets to zero every time a new run starts.
Split screens
Now let’s move on to the display itself. This event display shows three different views of the same proton collision. The three views help convey all the information about a three-dimensional event on a two-dimensional surface.
Physicists on ATLAS use interactive versions of this and other event displays to delve deeply into the details of any collision event. Static images such as the one decoded here are created to be shown to scientists from other collaborations and the general public, and thus may be cropped, rotated, or differently colored compared to the views the physicists use on a daily basis.
View A shows the ATLAS detector from the side. Onto this lengthwise slice of the ATLAS detector is projected all of the information collected by the different detector systems.
View B shows a beams-eye view of the ATLAS detector. All of the information collected by the different detector systems is projected onto this cross-wise slice of the detector.
View C shows information only from two of ATLAS’ detector systems, the calorimeters. The different detector systems are not shown in this view.
Breaking down views A and B
The ATLAS detector is made up of a number of smaller sub-detector systems that each specialize in measuring certain properties of certain types of particle. The colors of the sub-detector systems are consistent between views A and B.
1: Collision point
Shows the point at which two protons collided in this event.
2: Direction of the particle beams
In view A, the proton beams enter from either side of the detector, cross at the collision point and exit through the opposite side of the detector. In view B, the proton beams travel into and out of the display through the collision point.
3: Tracking detectors
The innermost portion of the ATLAS detector contains three systems dedicated to measuring the momentum of charged particles: the pixel detector; semiconductor tracker; and transition radiation tracker. (To view the tracking detectors in detail, we recommend opening the event display in a new window and enlarging it.)
Zooming in close to the collision point you see the pixel detector in grey and black. In view A the pixel detector is directly above and below the collision point (1); in view B it directly surrounds the collision point.
Slightly farther from the collision point, also shown in grey and black, is the semiconductor tracker. In both the pixel detector and semiconductor tracker, the passage of a particle is indicated by a colored square. Grey squares show activity in part of the detector that, after more analysis, was not determined to be of interest to physicists. Black squares indicate no activity in that area of the detector.
Zooming out even more you see the transition radiation tracker in purple. Colored lines that radiate from the collision point through the transition radiation tracker show the passage of a particle that registered in all three tracking detectors.
4: Central solenoid magnet
The ATLAS detector contains two large magnet systems. The innermost magnet (green) is the central solenoid, which curves the tracks of particles as they pass through the tracking detectors. The curvature can be seen in view B, but not in view A, as the magnetic field bends the paths of particles in some directions but not others (in this case, paths are bent perpendicular to the proton beam direction).
Magnetic fields help scientists measure the momentum of charged particles; the more curved the particle track, the lower the particle’s momentum. They also help scientists tell particles apart, as particles with opposite charge bend in opposite directions in the same magnetic field.
The second – and much larger - toroid magnet system is not shown in the event display. This magnet system bends the paths of particles through the outer portions of the ATLAS detector.
5: Liquid argon calorimeter
This detector, shown in grey, measures the energies of electromagnetic particles such as electrons and photons. Energy deposits left by particles are shown as yellow rectangles.
Electrons can be distinguished from photons by the presence or absence of associated tracks in the tracking detectors. Electrons, which are charged, will leave a track before depositing their energy in the liquid argon calorimeter, while photons will leave no track.
6: Tile calorimeter
This detector, shown in red, measures the energies of hadronic particles such as protons and neutrons. Energy deposits are again indicated by yellow rectangles.
Charged hadrons—such as protons—will leave a track in the tracking detectors before depositing their energy in the tile calorimeter, while neutral hadrons—such as neutrons—will not.
7: Muon spectrometer
The muon spectrometer (blue) measures the passage of muons, heavy particles that do not stop in either of the calorimeters. The muon spectrometer is only partially shown in this event display, as this collision did not produce muons. When muons are created in a collision event, they will leave tracks in the tracking systems, and may deposit energy in one or both calorimeters before interacting with the muon system and ultimately traveling out of the detector.
View C – the Lego plot
While views A and B show information from all parts of the ATLAS detector, view C shows only the energy deposits left by particles in the liquid argon calorimeter (red bars) and tile calorimeter (green bars). This view gives an immediate impression of how much energy was carried away from the collision by a particle or jet.
This type of view is known as a “Lego plot” by physicists, as it stacks the energy collected by the calorimeters on top of each other. Yellow circles indicate clusters of energy deposited by particles or jets.
View C takes the guesswork out of matching energy deposits with each other. Presented only with views A and B, it would be very difficult for you to tell which clusters of energy deposits are associated with a given particle. In view B, for example, energy deposits that appear to be right next to each other—and thus associated with the same particle—could be located at opposite ends of the detector when seen in view A. View C shows the energy as a function of two other parameters called η and φ, which are related to the location of particles along and around the detector.
Bringing it all together – a jet
The white circles labeled by the number 8 shows how the same jet of particles looks in the three different views. The circles mark only the energy deposited by the jet in the calorimeters. Tracing back to the collision point in views A and B, you can also see associated tracks left by the particles in the jet as they passed through the tracking detectors before stopping and depositing all their energy in the calorimeters.
That’s it for this ATLAS event display. To view more displays recorded in 2009 by the ATLAS detector, including a “three-dimensional” display of this same event and collisions that created muons, visit the latest events page. For more information about how particles are measured in the ATLAS detector watch this video overview.
And stay tuned for tomorrow's introduction to the LHC Page 1 display, which will help you follow the LHC accelerator as it ramps up to 7 TeV collisions.
