In a darkened barn in Sweden in 1941, astronomer Erik Holmberg constructed two identical sets of 37 lightbulbs, arranged in rings, to study the effects of a close encounter by two passing galaxies.
Using a light sensor connected to a device that measured electric current, Holmberg carefully charted, by hand, gravitational effects in energy signatures as he moved the two sets of bulbs closer together, and noted the emergence of "spiral arm" patterns.
He correctly concluded that galaxies can cluster and merge together as a result of such close passages. The experiment demonstrated the power of simulations and visualizations in understanding complex astrophysical phenomena, even before the era of computing.
Flash forward more than 70 years, and Holmberg's lightbulb galaxies spring to life in three-dimensional visualizations made possible by advances in programming, computing power, observational data, theory and a smattering of graphical artistry.
In a windowless room at the Kavli Institute for Particle Astrophysics and Cosmology, visitors wearing 3D glasses witness the grand gravitational interplay of two large galaxies passing one another, their spiral arms swinging out like choreographed combatants. Then the galaxies collide in a burst of light, with the scattered bits circling back and joining a new, larger galaxy. The two-minute, highly detailed visualization encapsulates 2 billion years, incorporates 40 million particles, and plays out on a 123-inch screen, offering an immersive and interactive way to dial back the universe's clock and refine calculations about its progression by comparing the visualization with observations.
The film includes about 40,000 separate "time steps," strung together into a movie, and required the equivalent of about 200,000 computer processor hours—a measure of the amount of time it would take a single processor to complete the visualization—to complete.
The visualization
Like Holmberg’s experiment, today’s high-tech visualizations provide visual representations of real-world phenomena. But they also take those simulations further with realistic imagery and three-dimensional perspectives that can shine a new light on the underlying data and theory.
To create a visualization, researchers today start with simulations that are based on theories and models, as well as an underlying question that they hope to answer. They can program in the laws of physics and step back the clock to allow their mini universe to evolve—dusty clouds form into planets; stars and galaxies take light as the universe expands; and dark matter spreads its invisible tendrils amongst it all.
Visualizations can be used to see the unseen, magnify the supersmall and shrink the supermassive. They can empower researchers to act as film directors, selectively eliminating or highlighting parts and processes, crunching millions of years into mere seconds, and choosing specific lighting and angles and actions that they want to call out. Some sophisticated visualizations allow viewers to interact with the animations, flying over, spinning around or traveling through objects, and can incorporate 3D glasses for a more immersive experience.
Seeing the unseen
From the birth of stars to the motion of ethereal, web-like strands of dark matter, visualizations can cue researchers on details that may be overlooked or obscured in less sophisticated simulations, reveal whether the theories and assumptions used in the renderings are flawed, and even provide insight on how to improve them.
"The kinds of things that I work on seem so abstract and hard to visualize because we are talking about timescales of 14 billion years and length scales far outside our experience," says Stanford University and SLAC National Accelerator Laboratory Professor Risa Wechsler, who specializes in dark matter and related research.
Simulations and visualizations provided Wechsler and other researchers with the first glimpses of dark matter. Its structure was first seen in simulations, and observational data have since confirmed it. "That basic understanding of what the structure looks like was shown first in these kinds of simulations," Wechsler said.
She adds, "Without the movies, you just don't know what's going on. You really need that to get a physical picture, and to develop some intuition and some understanding of what's happening. Simulations are our way of doing experiments," as space doesn’t offer up a very convenient laboratory for hands-on experiments at such massive scales.
Because the scientific visualizations are attempts to accurately reconstruct the actual physics of the universe, the flaws in any visualization can be as telling as its level of accuracy and detail, says Tom Abel, an associate professor of physics at Stanford who leads KIPAC's computational physics department. With visualizations of complex data, Abel says, "You can right away see if something is wrong," which is instantly useful for refining the calculations and theories used to generate the visualization.
Harnessing the power of supercomputers
Generating a useful visualization—one that is both meaningful and manageable—requires today’s increasingly powerful supercomputers and increasingly large data sets.
Researchers conducting the most high-resolution, computing-intensive visualizations now speak in terms of computer processor hours, total processing speed, billions of particles represented, and thousands of processors, or “cores,” used to run each program.
Andy Nonaka, an applied mathematician in the Center for Computational Sciences and Engineering at Lawrence Berkeley National Laboratory, works with visualizations for complex simulations. These simulations can require the supercomputing power equivalent to tens and hundreds of thousands of desktop computers, and the data from each time step can fill up hundreds of gigabytes of memory.
The top supercomputers, such as the Hopper system at Berkeley Lab’s National Energy Research Scientific Computing Center, complete quadrillions of calculations per second at peak operation, with the combined power of hundreds of thousands of processor cores. Nonaka’s visualizations are typically less computing-intensive than simulations but can still require hundreds of computer processor cores to quickly render the graphics.
Paired with advanced visualization software, all that memory has helped Nonaka's research team better understand the physics of Type Ia supernovae—the largest thermonuclear explosions in the universe—allowing for the visualization of three-dimensional contours and movies of how the star explodes. Just five years ago, "most of our visualizations were of 2-D slices of data from a full 3D data set," he says.
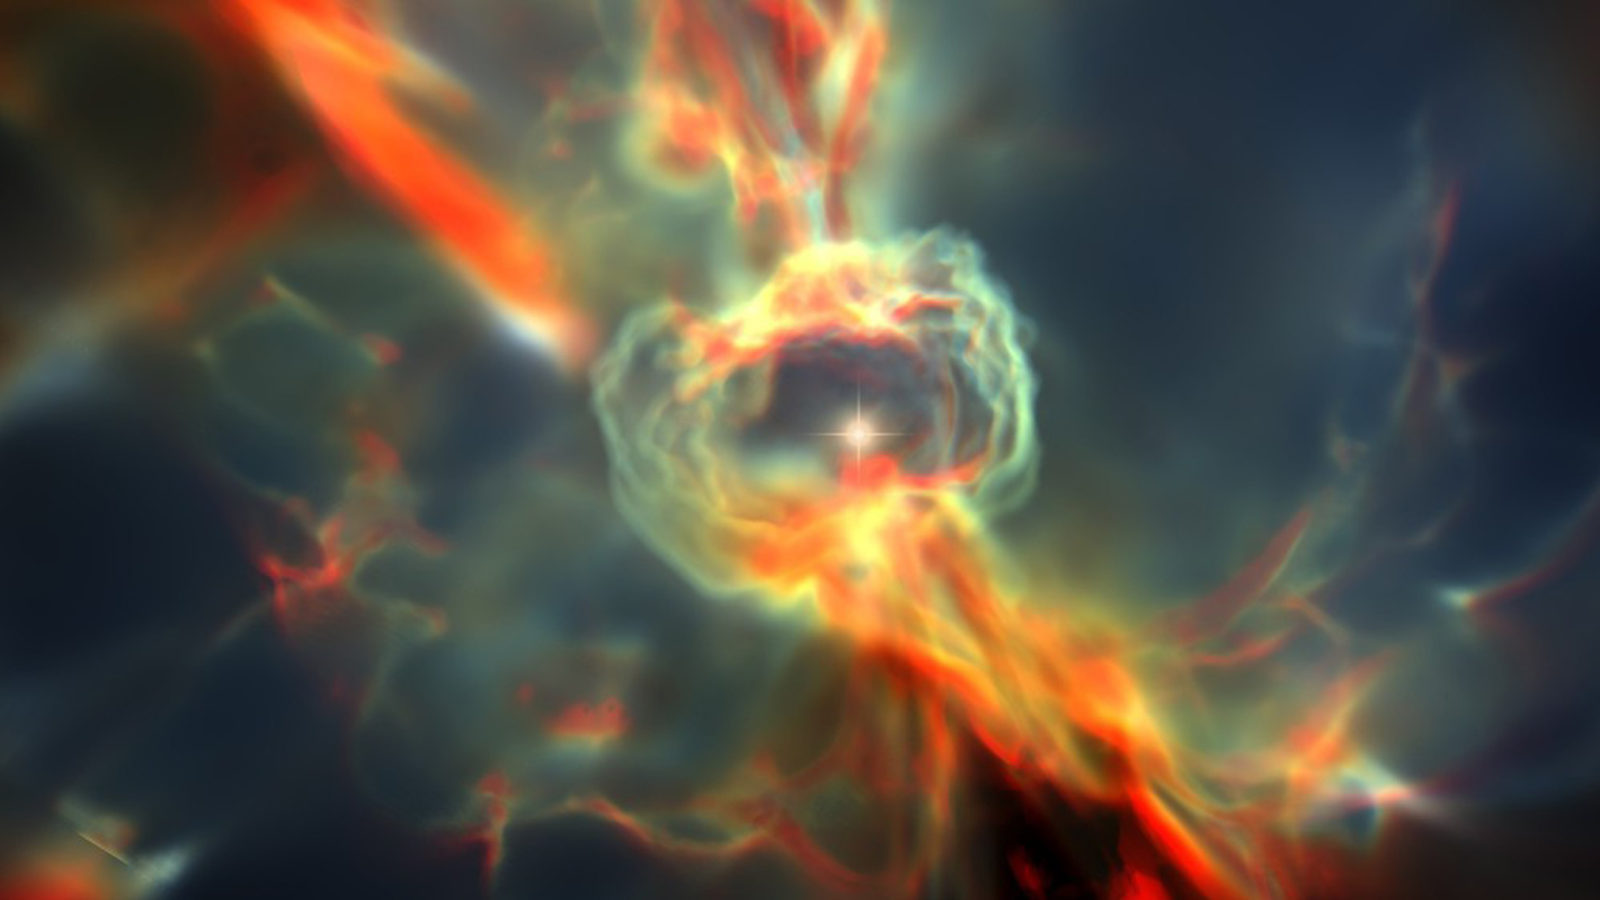
At Oak Ridge National Laboratory, researchers use one of the largest supercomputers in the world to run powerful simulations and visualizations of exploding stars, or supernovae, and other phenomena. There, a team of scientists recently used high-resolution visualizations to understand how some supernovae explosions can lead to the formation of incredibly dense neutron stars, which measure only about 12 miles in diameter but have a mass greater than our sun, and pulsars, which are spinning neutron stars that spew brilliant streams of particles from their magnetic poles.
"Without visualizations, we would have been waving our hands, still analyzing data," says Bronson Messer, acting group leader for scientific computing at Oak Ridge and adjunct assistant professor of physics and astronomy at the University of Tennessee. Instead, a visualization revealed that shockwaves from these explosions included rotational motion, changing how they propagated and interacted with matter.
Messer says that visualizations usually begin with a question that scientists are wrestling with. The scientist proposes the question to a visualization expert and "then throws a bunch of data at him," saying, in Messer’s words, "Why don't you play with this awhile—see if you can map my question to the data" in a visual way.