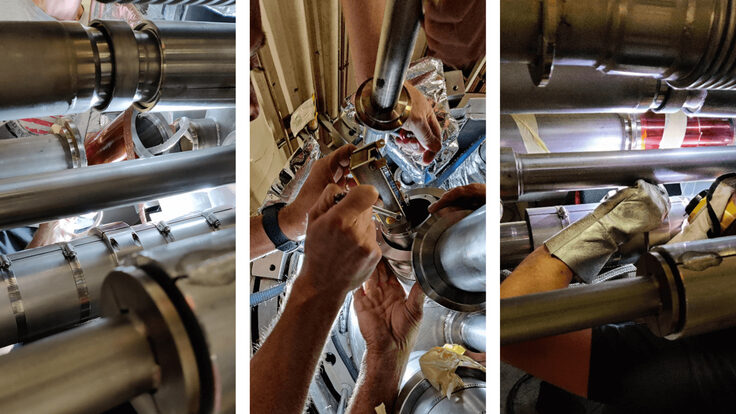
In 2010, the brand-spanking-new CMS and ATLAS detectors started taking data for the first time. But the question physicists asked was not, “Where is the Higgs boson?” but rather “Do these things actually work?”
“Each detector is its own prototype,” says UCLA physicist Greg Rakness, run coordinator for the CMS experiment. “We don’t get trial runs with the LHC. As soon as the accelerator fires up, we’re collecting data.”
So LHC physicists searched for a few old friends: previously discovered particles.
“We can’t say we found a new particle unless we find all the old ones first,” says Fermilab senior scientist Dan Green. “Well, you can, but you would be wrong.”
Rediscovering 50 years' worth of particle physics research allowed LHC scientists to calibrate their rookie detectors and appraise their experiments’ reliability.
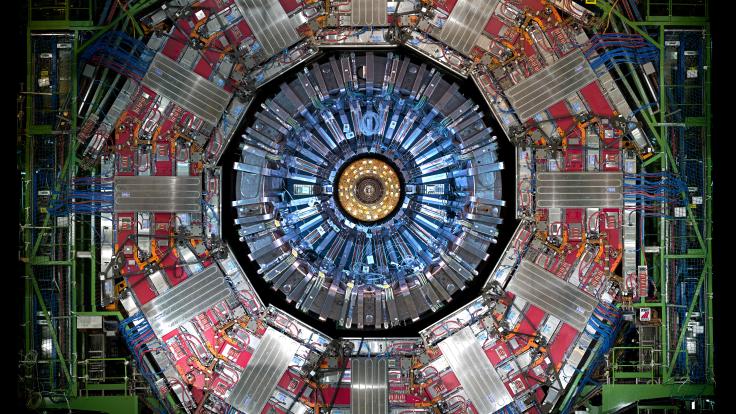
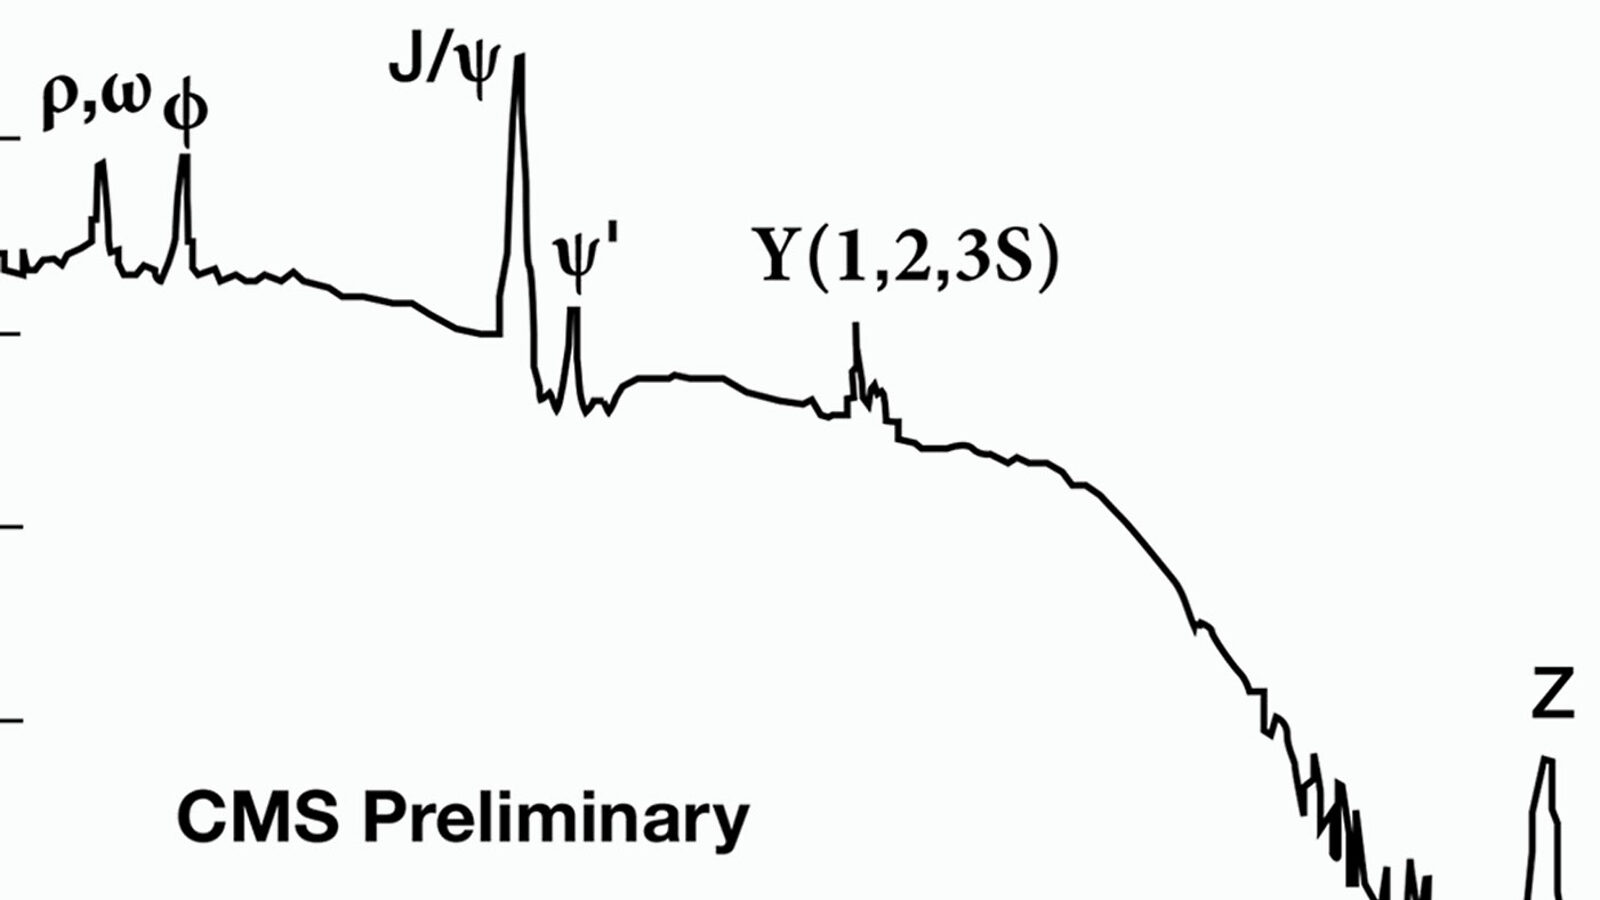
The CMS collaboration produced this graph using data from the first million LHC particle collisions identified as interesting by the experiment's trigger. It represents the instances in which the detector saw a pair of muons.
Muons are heavier versions of electrons. The LHC can produce muons in its particle collisions. It can also produce heavier particles that decay into muon pairs.
On the x-axis of the graph is the combined mass of two muons that appeared simultaneously in the aftermath of a high-energy LHC collision. On the y-axis is the number of times scientists saw each muon+muon mass combination.
On top of a large and raggedy-looking half-parabola, six sharp peaks emerge.
“Each peak represents a parent particle, which was produced during the collision and then spat out two muons during its decay,” Green says.
When muon pairs appear at a particular mass more often than random chance can explain, scientists can deduce that there must some other process tipping the scale. This is how scientists find new particles and processes—by looking for an imbalance in the data and then teasing out the reason why.
Each of the six peaks on this graph can be traced back to a well-known particle that decays to two muons.
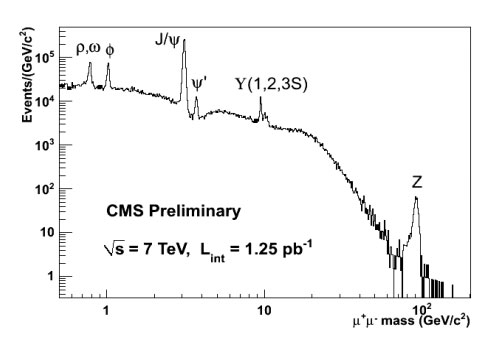
- The rho [ρ] was discovered in 1961.
- The J-psi [J/ Ψ] was discovered in 1974 (and earned a Nobel Prize for experimenters at the Massachusetts Institute of Technology and SLAC National Accelerator Laboratory).
- The upsilon [Y] was discovered in 1977.
- The Z was discovered in 1983 (and earned a Nobel Prize for experimenters at CERN).
What originally took years of work and multiple experiments to untangle, the CMS and ATLAS collaborations rediscovered after only about a month.
“The LHC is higher energy and produces a lot more data than earlier accelerators,” Green says. “It’s like going from a garden hose to a fire hose. The data comes in amazingly fast.”
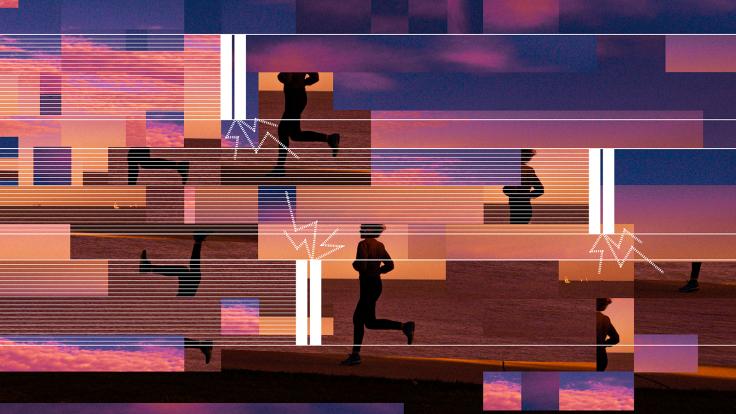
But even the LHC has its limitations. On the far-right side, the graph stops looking like a half-parabola and start looking like a series of short, jutting lines.
“It looks chaotic because we just didn’t have enough data for events at higher masses,” Green says. “Eventually, we would expect to see a peak representing the Higgs decaying to two muons popping up at around 125 GeV. But we just hadn’t produced enough high-mass muons to see it yet.”
Over the summer, the CMS and ATLAS detectors will resume taking data—this time with collisions containing 60 percent more energy. Green says he and his colleagues are excited to push the boundaries of this graph to see what lies just out of reach.